Projects

From data-driven analysis to full-stack applications and cutting-edge AI integrations. Here is a detailed look at some of the projects I'm most proud of.

Custom Markup Language Editor & Parser

Independent Software Developer

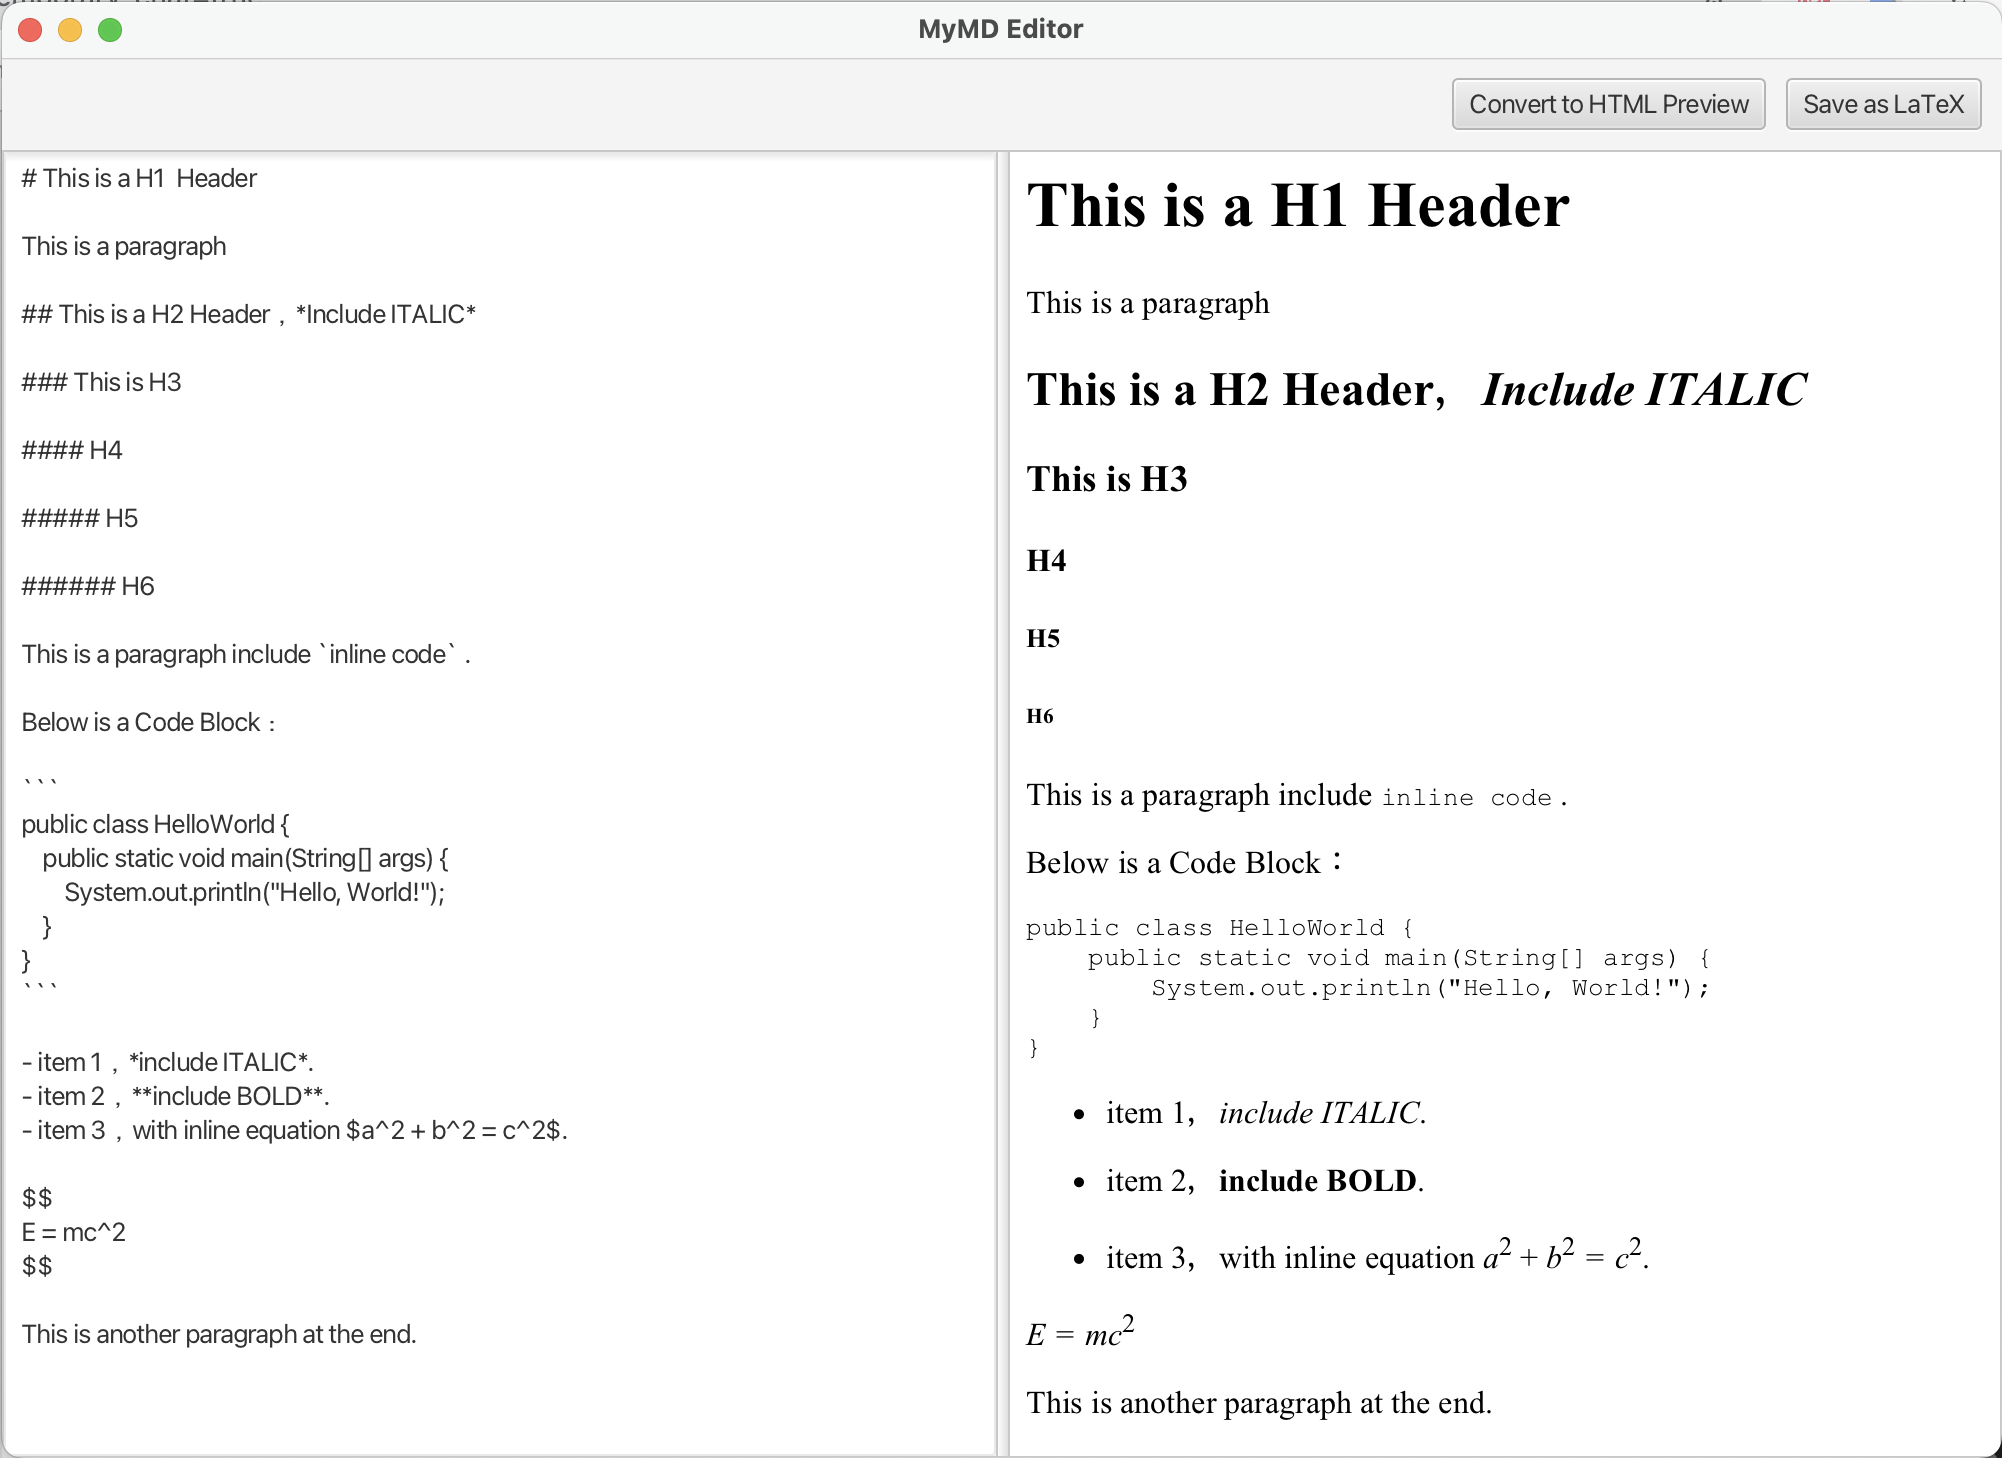
This project was born from a personal need for a tool that blends the simplicity and speed of Markdown with the professional typesetting and citation capabilities of LaTeX. To fill this gap, I independently designed and developed MyMD, a custom markup language, along with its dedicated desktop editor.

The application's core is a compiler front-end built with ANTLR, which accurately parses MyMD source into an Abstract Syntax Tree (AST). Pivoting from an initial, unstable regex-based prototype, the current architecture uses the Visitor pattern to convert the AST into a Pandoc-compatible JSON format. This decouples the parser from the back-end, enabling robust and seamless export to HTML and LaTeX. The entire desktop application was built from the ground up using JavaFX and follows the MVVM architecture to ensure a clean, testable, and extensible codebase, with reliability backed by a suite of JUnit 5 unit tests.

Currently, the project is a Minimum Viable Product (MVP) with a live-preview editor. The long-term vision is to evolve it from a simple GUI into a full-featured Integrated Development Environment (IDE).

Technologies: Java, JavaFX, ANTLR, MVVM, JUnit 5, Maven, Pandoc

MyMD Custom Markup Editor Screenshot

UCLA HCI Research Collaboration

Lead Researcher / AI Developer

In collaboration with a faculty member at UCLA, I am leading a research project investigating the effects of eXplainable AI (XAI) on user trust and perceived empathy in emotional support conversational agents. This work addresses a critical challenge in Human-Computer Interaction (HCI): the "black box" nature of AI systems, which can hinder the development of a supportive human-AI relationship in sensitive contexts.

The core research question is: How does providing AI-generated explanations for its emotion detection affect a user's trust and sense of connection? To answer this, I have designed a comparative user study employing an A/B testing methodology. This involves prototyping two versions of a chatbot: an XAI version that transparently explains its emotional inference and allows users to correct it, and a non-XAI control version. The project is currently in the foundational phase, which involves conducting an in-depth literature review and formalising the research methodology.

A key innovation of this study is its focus on user agency, exploring how the ability to correct the AI's predictions can help repair interactional breakdowns and foster a more collaborative human-AI partnership. The expected outcome is a set of evidence-based design guidelines and a research paper suitable for submission to a peer-reviewed HCI conference or journal.

Fields: Human-Computer Interaction, Explainable AI, Large Language Models, User-Centred Design

Behavioural Modelling of Excessive Trading

Lead Developer / Quantitative Analyst

This project was sparked by observing the tech market's sharp downturn following the release of the DeepSeek model, which seemed to defy rational market theory. It led me to question: what behavioural drivers lead to such excessive trading? This study was designed to quantitatively model the impact of psychological biases on trading activity.

As the architect of the technical pipeline, my greatest challenge was not just implementing the model, but selecting the correct observable indicators to accurately measure latent behaviours. I built a hybrid data analysis workflow, using Python (pandas) for data cleaning and engineering a mixed-language environment in WSL to integrate R (via rpy2) for the core Partial Least Squares Structural Equation Modelling (PLS-SEM).

The model successfully validated that behavioural biases have a significant impact on excessive trading. Notably, while Herding and Anchoring were influential, the analysis revealed that Fear of Missing Out (FoMO) was by far the most powerful predictive factor. The anonymised analysis code for this study is available on GitHub.

Technologies: Python, R, pandas, PLS-SEM, rpy2, Matplotlib, Seaborn

Hierarchical University FAQ System

Team Member / Software Developer

As part of a four-person team in a university software engineering course, I co-developed the back-end for a hierarchical FAQ system designed for university kiosks. The project's goal was to provide students with quick, accessible answers and route unanswered queries to staff.

Our process mirrored a standard software development lifecycle. We began by conducting simulated user interviews to gather requirements, which informed our system design. A key academic requirement was to model our architecture with UML (use case, sequence, and class diagrams) before writing any code. As a developer on the team, I was jointly responsible for implementing the back-end logic in Java following the MVC architecture. This included authoring the search module, which used Lucene for keyword matching, and ensuring our code was thoroughly tested with JUnit.

Technologies: Java, MVC, Lucene, UML, Git, JUnit

FAQ System UML Class Diagram

Ultra Marathon Runner Performance Analysis

Independent Data Analyst

In this independent data analysis project, I investigated a Kaggle dataset of over 200,000 ultra-marathon records to uncover performance patterns over time. The primary goal was to explore how factors like event year, distance, and club affiliation correlated with athlete performance.

Using Python libraries such as Pandas, Matplotlib, and Scikit-learn, I cleaned and preprocessed the extensive dataset. I then applied K-means clustering and identified three distinct performance groups across the 50km, 100km, 50mi, and 100mi race categories. The analysis revealed a general trend of improving performance in recent years, with a notable exception in the 100km category, where the mid-century (c. 1950-1990) cluster of runners demonstrated the strongest results. Further linear regression analysis on club affiliation uncovered more nuanced trends, compiling all findings into a detailed report written in LaTeX.

Technologies: Python, Pandas, Matplotlib, Scikit-learn, K-means Clustering, LaTeX

Data Visualization Chart from Marathon Analysis